Some basic joomla settings before starting to develop extension.
How to enable site debugging
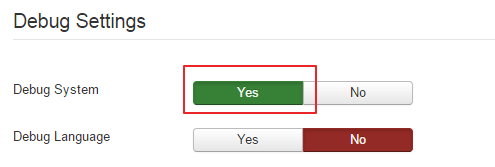
We can start in Global Configuration and move to the System tab. Have a look in the “Debug Settings” box. The first thing to change is the “Debug System” setting. Change this to yes and save the configuration. The main purpose for this is so that if an SQL error occurs, it will throw an error page. I see so many silly errors in custom extensions just because developers have not tested with this setting on (particularly during installation of their extension).
After saving, you will notice a heap of output at the bottom of the page. This is actually generated by the debug plugin, and we’ll have a closer look at that shortly.

How to enable language debugging
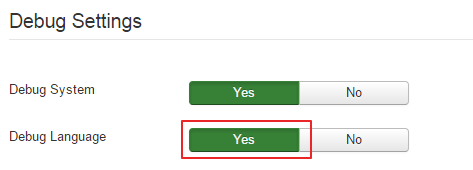
The next setting we’ll look at is Debug Language. When you turn this on, the screen goes a bit strange. What do all the stars mean? Well, the stars are actually a good thing. Stars mean that the text that is displaying is being run through the Joomla translation system *and* that there is a matching translation. If you see a pair of double question marks, it means that the string is trying to be translated, but the translation can’t be found. Finally, if you don’t see anything around a string of text or a phrase, that text is not being translated at all. For now, we’ll just turn this off again because all the bling can get annoying after a while.

Extended session time
The last thing we can do on this tab is increase the session lifetime. I usually set this to 1500 minutes so that while I’m spending time in the code (or getting that next cup of coffee), my session doesn’t time out and log me out. One saving grace in 1.6 is the fact that if you are logged out, you will return to the page you are on.

Setting error reporting
Let’s move to the Server tab. There is a very important setting here called Error Reporting. You need to set this to Maximum. By default, most PHP servers don’t display error and by setting it to maximum Joomla forces the server to display them. If we don’t do this and we get a fatal error, all you will get is a totally useless white screen of death.

The debug plugin
That’s all we need to do in Global Configuration so we can save those settings and go to the Plugin Manager, and let’s try that again. Ok. We are looking for the debug plugin. This plugin collects information when Debug System is turned on. Put debug in the search filter so we can find it quick and then click to edit it. Ok, there are a few things to look at here.
First thing is that this plugin can be configured to only be available to certain user groups. This means that you, as a Super Admin can be testing the site while leaving the site free of diagnostics for your regular visitors.
Next is a setting that will show profiling. There are a number of markers in the Joomla code that record the time a step takes and also the memory used. This setting shows you that information and you can use it as a guide for how efficient a particular process is.
Next is a setting to show the SQL queries that have been executed to display this page. This can be useful for tracking down query problems or simply to detect when there are too many queries being run for a page.
The last setting in the block is to display the memory used to generate the page. In practice, I generally have these all turned off unless I’m doing some optimization.

Now, scroll down to the Language options, where you’ll find some interesting features.
The first setting allows you to see if there are errors when PHP parses the INI language files. We’ll cover the INI files in Unit 2, but I’ll just mention now that it’s very easy to introduce syntax errors in them that prevent them from parsing.
Following that is a setting that allows you to see which language files are being loaded in the code and whether they were successfully loaded.
Show Language String allows you to see the language strings that are being run through the translation system but do not have a corresponding translation. The output is a suggested line that you can simply cut and paste into the appropriate INI file. This is a really cool feature that allows you to mop up translation strings in just a couple of steps. The remaining options simply allow you to customise how those suggestions are displayed.Using those settings effectively is a topic for another day.
For now, though, we’ll disable the plugin so we don’t clutter the display for our next unit, which is where we start looking at component design. see you real soon.


