Algebra

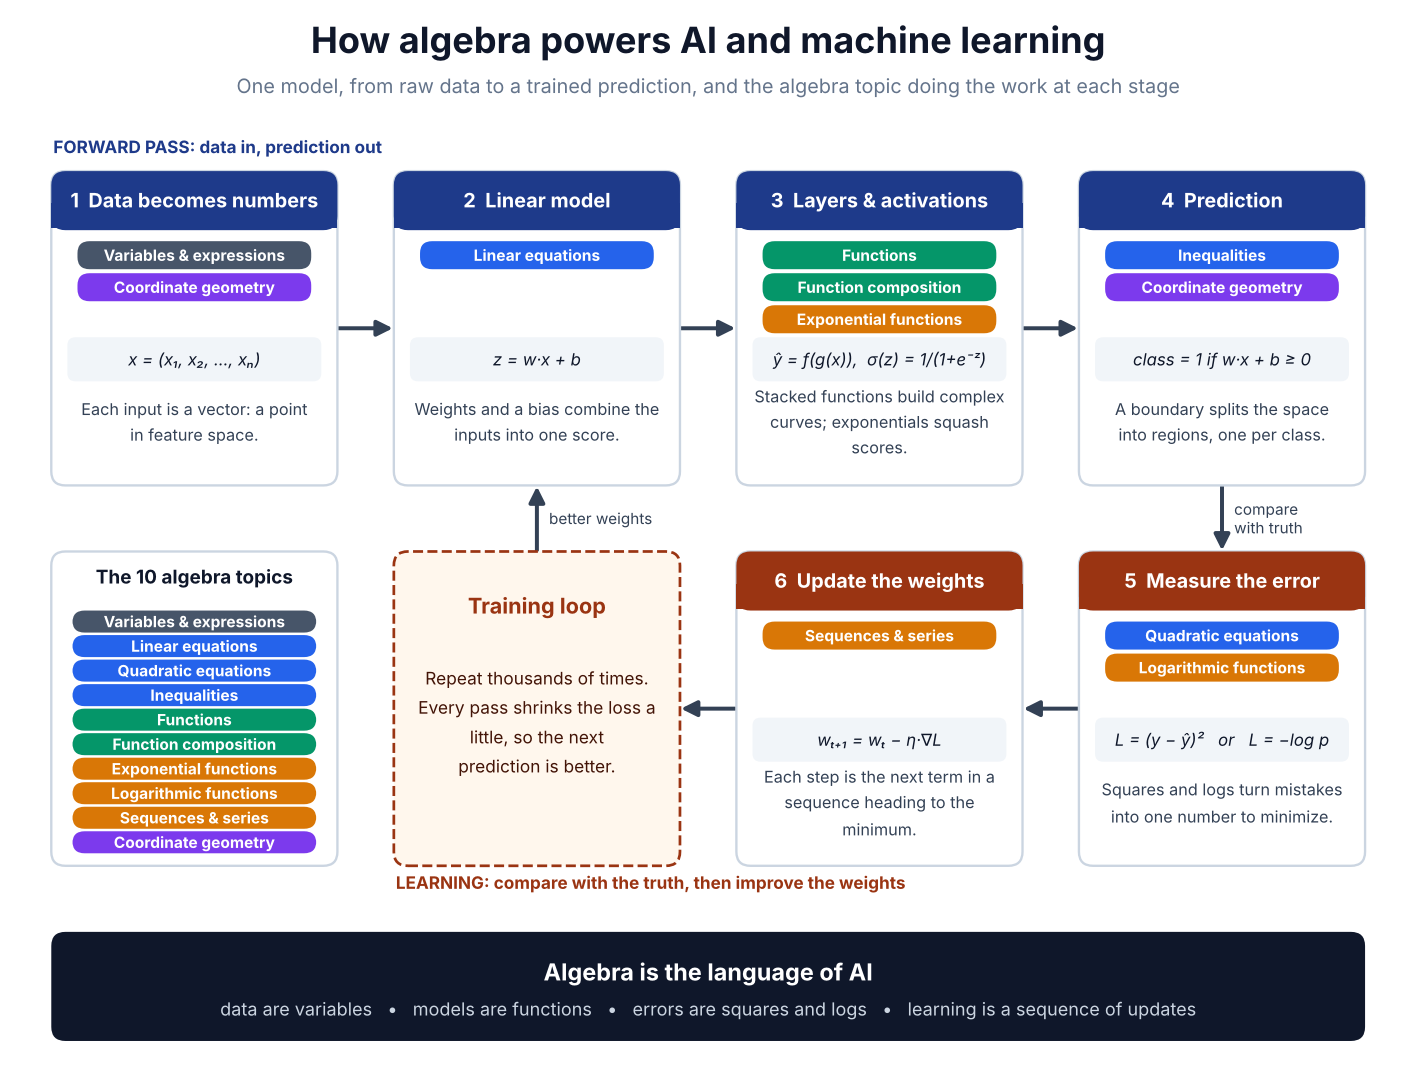
Build smarter skills with practical AI tutorials and powerful machine learning apps and Calculators.


Calculator    Quiz
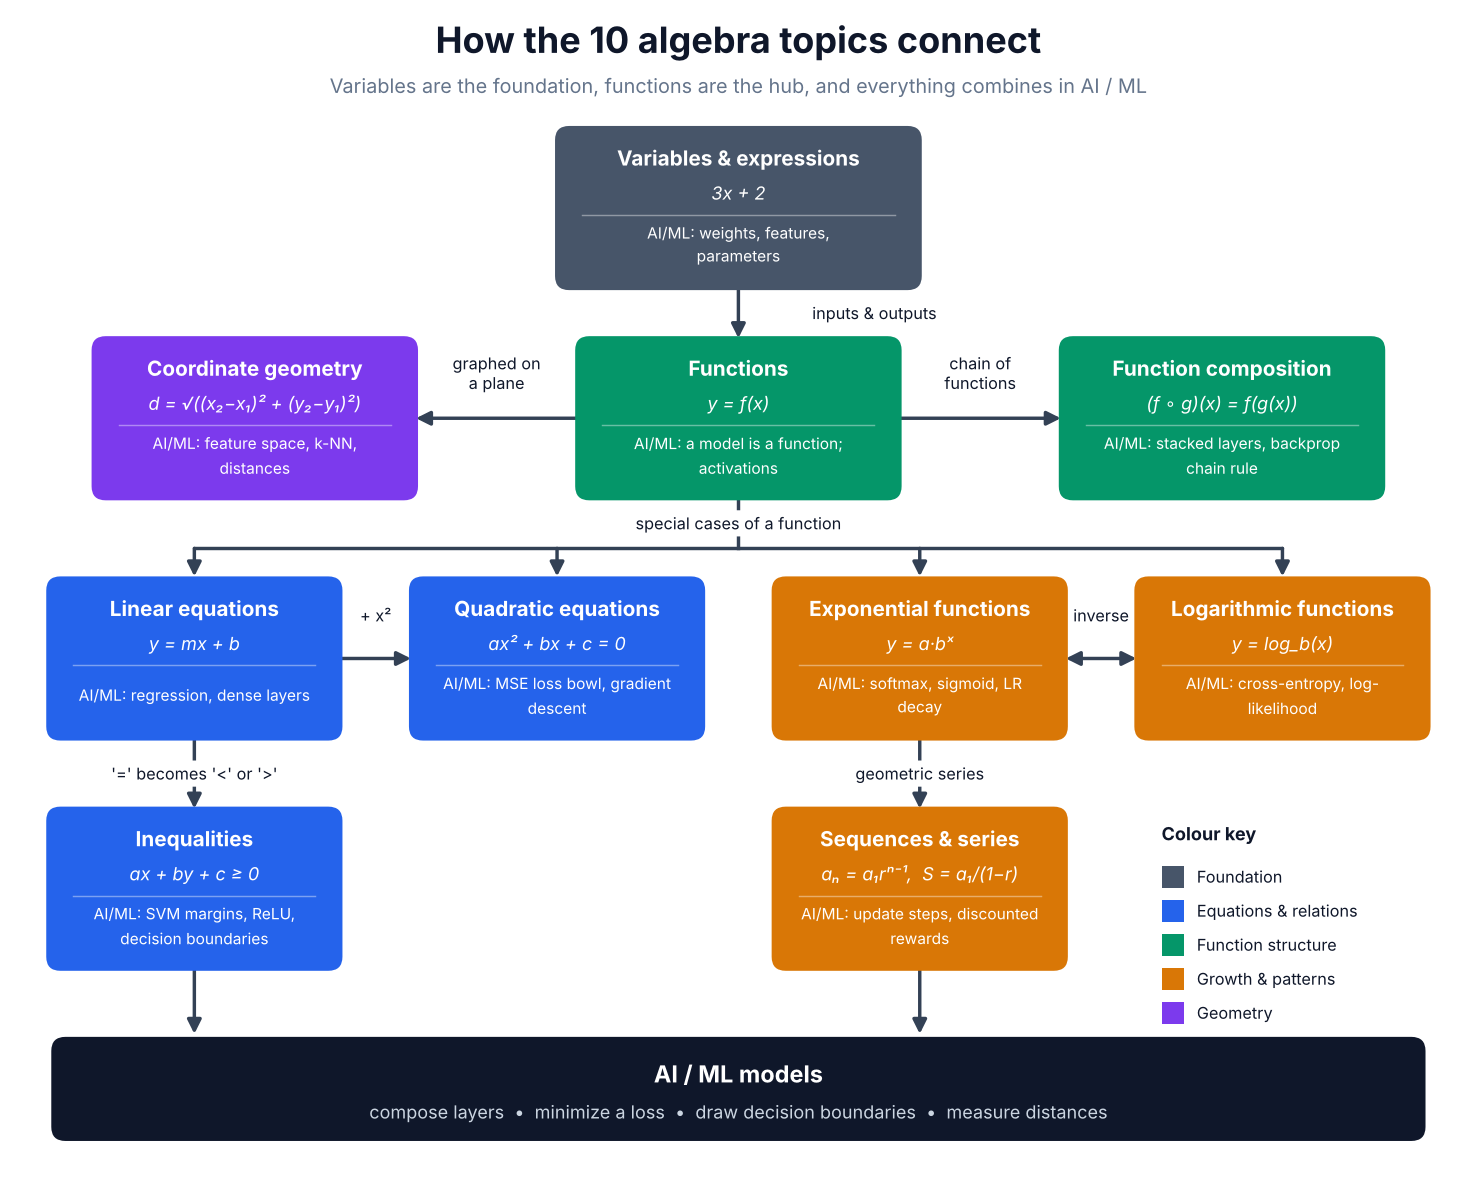
Variables and expressions   |   Linear Equations   |   Quadratic equations   |   Functions   |   Exponential Functions   |   Logarithmic Functions   |   Sequences and series   |   Inequalities   |   Coordinate geometry
1. Variables and expressions

Explanation

A variable is a symbol that stands for a value that can change, and an expression combines variables, numbers and operations. Evaluating it for different inputs gives different outputs.

Equation

3x + 2

Where it is used in AI / ML

Every model parameter, feature and weight is a variable. Neural network pre-activations (w·x + b) and loss terms are expressions evaluated in code.

1. Variables and expressions diagram

2. Linear equations

Explanation

A linear equation relates variables with a constant rate of change, drawing a straight line. The slope m is the change in y per unit x and b is where the line crosses the y-axis.

Equation

y = mx + b

Where it is used in AI / ML

Linear regression, the dense layer of a neural network (y = Wx + b) and the scoring function in logistic regression and SVMs are all linear equations.

2. Linear equations diagram

3. Quadratic equations

Explanation

A quadratic has a squared term and graphs as a parabola with up to two roots. The vertex marks the minimum or maximum point.

Equation

ax² + bx + c = 0, x = (−b ± √(b² − 4ac)) / 2a

Where it is used in AI / ML

Mean squared error is quadratic in the weights, so its bowl-shaped curve has one minimum that gradient descent searches for. Second-order optimization also uses quadratic approximations.

3. Quadratic equations diagram

4. Functions

Explanation

A function assigns exactly one output to each input. It is a rule that transforms data from one form into another.

Equation

y = f(x), e.g. f(x) = 1 / (1 + e⁻ˣ)

Where it is used in AI / ML

A trained model is itself a function mapping inputs to predictions. Activation functions (sigmoid, ReLU, tanh) add non-linearity to neural networks.

4. Functions diagram

5. Function composition

Explanation

Composition feeds the output of one function into another, written f(g(x)). The inner function runs first, then the outer one.

Equation

(f ∘ g)(x) = f(g(x))

Where it is used in AI / ML

Deep networks are long chains of composed layers, and backpropagation uses the chain rule to differentiate these compositions.

5. Function composition diagram

6. Exponential functions

Explanation

An exponential function has the variable in the exponent, giving rapid growth (b > 1) or decay (0 < b < 1). The number e ≈ 2.718 is the natural base.

Equation

y = a·bˣ, y = eˣ

Where it is used in AI / ML

Softmax and sigmoid are built from eˣ, and learning-rate decay schedules are exponential. Exponentials also model compounding growth in data and compute.

6. Exponential functions diagram

7. Logarithmic functions

Explanation

A logarithm is the inverse of an exponential: it tells you the power needed to reach a number. It turns multiplication into addition and compresses large ranges.

Equation

y = log_b(x) ⇔ bʸ = x

Where it is used in AI / ML

Cross-entropy and log-likelihood losses use logs, log-probabilities prevent numerical underflow, and log scales tame skewed features.

7. Logarithmic functions diagram

8. Sequences and series

Explanation

A sequence is an ordered list of terms, and a series is the sum of those terms. A geometric series with |r| < 1 converges to a finite value.

Equation

aₙ = a₁rⁿ⁻¹, S = a₁ / (1 − r)

Where it is used in AI / ML

Training is a sequence of weight updates, discounted future rewards in reinforcement learning form a geometric series, and time-series models work on sequences.

8. Sequences and series diagram

9. Inequalities

Explanation

An inequality compares quantities with <, >, ≤ or ≥, and its solution is a range or region rather than one point. In two variables it shades a half-plane.

Equation

ax + by + c ≥ 0

Where it is used in AI / ML

Classifiers decide a class by which side of a boundary a point falls on, SVMs maximize margins under inequality constraints, and ReLU, clipping and regularization bounds all use inequalities.

9. Inequalities diagram

10. Coordinate geometry

Explanation

Coordinate geometry places points on axes with (x, y) values so that distances, slopes and shapes can be computed algebraically. Data points become locations in space.

Equation

d = √((x₂ − x₁)² + (y₂ − y₁)²)

Where it is used in AI / ML

Each data sample is a point in feature space. k-NN, k-means clustering, embeddings similarity and vector distance searches all rely on distance and geometry.

10. Coordinate geometry diagram

Related Calculators


Important Note: All the Calculators listed in this site are for educational purpose only and we do not guarentee the accuracy of results. Please do consult with other sources as well.